What I Learned Profiling PyTorch Memory Leaks Across Two Backends
What I Learned Profiling PyTorch Memory Leaks Across Two Backends
A few weeks ago I published a small catalog of four PyTorch memory leaks running on Apple Silicon, using a profiler I help maintain. The work was tighter than anything I'd shipped before: real workload, reproducible scripts, honest numbers. The post landed well, and the question I kept getting in replies was always some version of the same thing.
Does any of this matter on CUDA?
The honest answer was that I didn't know. So I rented an NVIDIA A30 and ran the same eight patterns (I added four more along the way) on both backends. This essay is what I learned. Not the marketing version. The actual lessons, including the one I was wrong about.
If you just want the data, the cross-platform report is here and the repo is here. If you want the story behind the numbers, keep reading.
The hypothesis I started with
Apple's MPS backend exposes memory allocations directly. CUDA, by contrast, uses a caching allocator that holds onto previously-freed blocks and re-issues them on demand. The textbook implication is straightforward: a leak on MPS should look loud, and the same leak on CUDA should look quiet, because the caching allocator absorbs the churn.
If true, that's a strong argument for profiling on MPS even if your training cluster runs CUDA. The cheap laptop catches what the expensive cluster hides.
I ran the eight patterns expecting at least one or two clean examples of "MPS-loud, CUDA-silent." That would have made for a great post.
What I found was more interesting, and not what I'd expected.
The setup, briefly
Same code on both backends. Same model (ResNet-18 adapted for CIFAR-10, 32x32 inputs, ~11M parameters). Same data (10,000 CIFAR-10 training samples, batch size 128). Same five epochs of training. The only thing that changes between runs is the bug.
MPS runs were on a Mac mini M4 with 16 GB unified memory. CUDA runs were on a rented NVIDIA A30 (24 GB, Ampere) at JarvisLabs, total cost $0.20 for all 17 training runs. Less than a coffee.
Each run is instrumented with Stormlog: phase tracking around epochs, alert callbacks for fragmentation and large allocations, an OOM flight recorder, and a PNG timeline emitted at the end. The timeline is the single most useful artifact. You can read a memory leak in three seconds from a flat-versus-rising curve.
Leak 1: Forward hook activations
The most common GPU memory bug I've seen in real code. Someone registers a forward hook on a layer to capture activations for visualization, interpretability, or just debugging. They store the output in a list. They remember to call .detach() because they read somewhere that's important. They forget that .detach() doesn't move the tensor off the device.
activation_store = []

def _leaky_hook(module, input, output):
    activation_store.append(output.detach())  # still on GPU
Each batch adds a [128, 512, 4, 4] tensor from layer4. That's about 4 MB per batch. Over 390 training steps, you've accumulated 1.5 GB of activations sitting in a Python list, and the activation list outlives the training run.
The fix is three changes that should all be applied, but any one of which would prevent the leak: bound the buffer with collections.deque(maxlen=1), move the tensor to CPU inside the hook (output.detach().cpu()), and remove the hook handle when you're done debugging.
Here's what the leaky run looks like on CUDA:
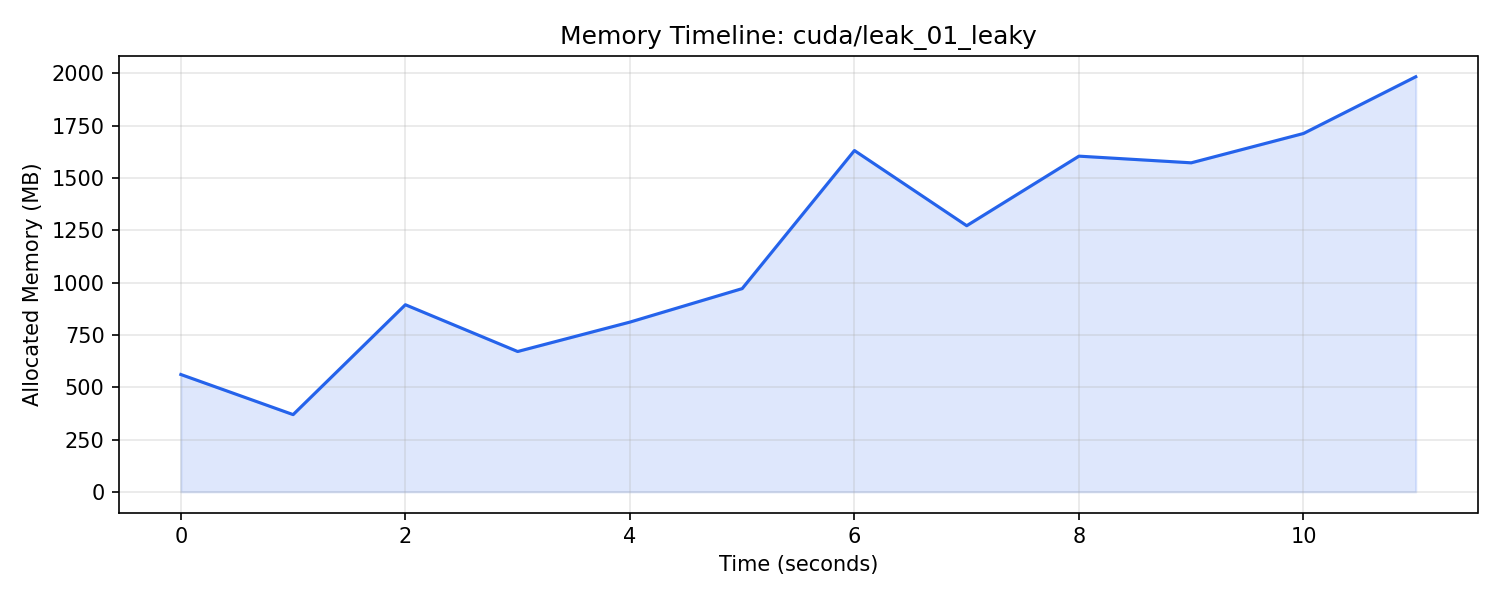
A clean staircase from 370 MB to roughly 2 GB across 11 seconds. Every step is another batch of activations getting added to the list. The local dips never return to baseline because the list keeps growing.
And the fixed run:
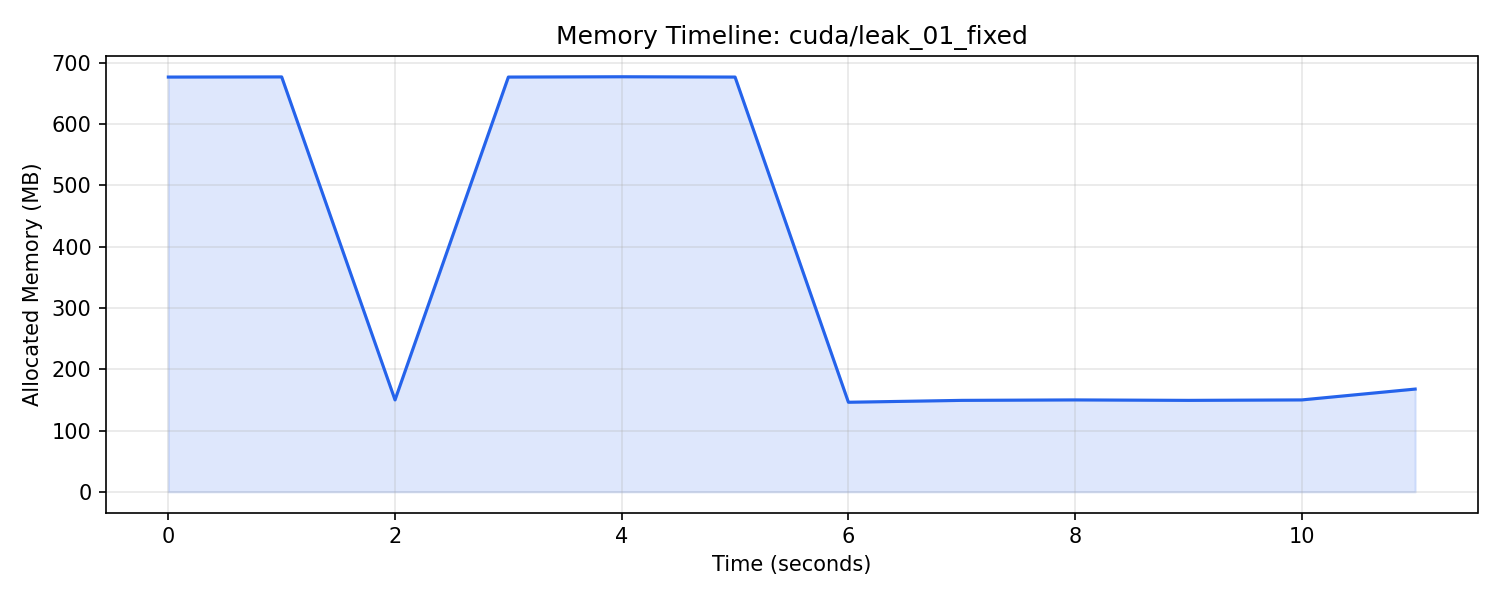
The training phase runs at around 675 MB and drops cleanly when training ends. That's what healthy memory looks like.
| Backend | Leaky peak | Fixed peak | Ratio |
|---|---|---|---|
| MPS | 11,612 MB | 713 MB | 16.29x |
| CUDA | 1,983 MB | 712 MB | 2.93x |
Same bug. Same code. The MPS ratio is over five times larger than the CUDA ratio. This is the pattern that holds across most of the catalog.
What I was wrong about
I expected the post to be built around "MPS loud, CUDA silent." Of the eight patterns I ran, the breakdown turned out to be:
- Six were visible on both backends.
- One was effectively silent on both (Leak 6, gradient accumulation scaler) at this training scale.
- One OOM'd both backends (Leak 7, retained validation outputs).
None of the eight produced the clean "MPS exposes what CUDA hides" result I was looking for.
The real finding is less dramatic but more useful: CUDA's caching allocator dampens leaks, it doesn't hide them. Look at the ratios across the four leaks visible on both backends:
| Leak | MPS ratio | CUDA ratio | MPS / CUDA |
|---|---|---|---|
| Forward Hook Activations | 16.29x | 2.93x | 5.6x |
| Missing zero_grad | 10.30x | 7.33x | 1.4x |
| Device Tensor Retention | 2.61x | 1.90x | 1.4x |
| Autocast Scope | 11.51x | 2.13x | 5.4x |
The CUDA ratios are real. They're meaningful. A senior engineer staring at a 2.93x peak memory increase between a leaky and fixed run would absolutely flag it. But if you were trying to reason about how severe a leak is from the CUDA numbers alone, you'd misjudge it by a factor of five for the worst cases.
That has practical implications. If you only profile on the training cluster, you'll catch the leak eventually. But you'll underestimate the cost of letting it ship, and you'll be less aggressive about prioritizing the fix.
Leak 2: Missing zero_grad
This one is interesting because it produces two separate failures from the same root cause.
def leaky_train_step(model, images, labels, criterion, optimizer):
    # no zero_grad
    outputs = model(images)
    loss = criterion(outputs, labels)
    loss.backward()
    optimizer.step()
Without zeroing gradients between steps, gradients accumulate. The gradient buffers themselves are fixed-size on most allocators, so the raw .grad tensors don't grow. But real-world code rarely just calls .backward() and moves on. Any code that inspects gradients (computing norms, storing snapshots for monitoring, dumping to disk) creates new device tensors proportional to the accumulated values. Those references pile up.
There's a second, separate failure: the training itself diverges. With stale gradients corrupting the update direction, the optimizer walks in essentially random directions. On CIFAR-10 with 10 classes, validation accuracy collapses to roughly 10% — chance-level guessing.
| Backend | Leaky peak | Fixed peak | Ratio | Leaky val acc |
|---|---|---|---|---|
| MPS | 7,266 MB | 706 MB | 10.30x | 10.7% |
| CUDA | 4,967 MB | 678 MB | 7.33x | divergent |
The profiler catches the memory leak. The validation evaluation catches the accuracy collapse. Same root cause, two different instruments, two different findings. It's a good reminder that profiling and evaluation answer different questions and you need both.
The fix is one line:
optimizer.zero_grad(set_to_none=True)set_to_none=True is the modern preferred form because it actually frees the gradient buffers rather than zeroing them in-place. On most allocators the difference is small, but it adds up for models with sparse gradients.
Leak 6: The one that turned out to be silent
I'd added this leak hoping it would be the canonical "MPS catches it, CUDA hides it" example. Gradient accumulation with a misconfigured GradScaler is exactly the kind of subtle bug that should look different on different backends, because GradScaler is CUDA-specific and the caching allocator should have plenty of opportunity to mask its overhead.
ACCUM_STEPS = 4

with torch.autocast(device_type=device_type, dtype=torch.float16):
    outputs = model(images)
    loss = criterion(outputs, labels) / ACCUM_STEPS

scaled_loss = scaler.scale(loss)
scaled_loss.backward()
_scaled_losses.append(scaled_loss)  # bug: retain graph reference

# bug: step every micro-batch instead of every ACCUM_STEPS
scaler.step(optimizer)
scaler.update()
optimizer.zero_grad()
Two bugs in one pattern. Calling scaler.step() and scaler.update() every micro-batch defeats the purpose of accumulation. Retaining scaled loss tensors holds references to the autograd graph across batches.
I ran it on both backends and got:
| Backend | Leaky peak | Fixed peak | Ratio |
|---|---|---|---|
| MPS | 1,103 MB | 930 MB | 1.19x |
| CUDA | 422 MB | 459 MB | 0.92x |
A 1.19x ratio is barely a leak. A 0.92x ratio is, statistically, the fixed version using slightly more memory than the leaky one (well within run-to-run noise).
I had a choice here. I could have cut this leak from the catalog and the post would have read more cleanly. I could have run more epochs or used a larger model until the ratio got dramatic. Or I could just report what happened.
I reported what happened. The leak mechanism is real (you can read it directly from the code). It just doesn't accumulate enough memory in five epochs on 10,000 samples to dominate the baseline noise. On a longer training run, with a larger model, it would. At this scale, it's invisible on both backends.
The honest framing matters more than the cleaner narrative. If I'd cherry-picked, someone running the scripts would have eventually found that Leak 6 doesn't reproduce the way I described, and the whole repo would lose credibility. Better to leave the underwhelming finding in and explain it.
It's also a useful lesson in its own right: not every plausible bug shows up in a small benchmark. The size of your training run is part of your profiling configuration. A leak that's invisible at 10K samples might be a production OOM at 10M.
Leak 7: The one that killed both machines
This is the leak that should scare you.
def leaky_train_step(model, images, labels, criterion, optimizer):
    optimizer.zero_grad()
    outputs = model(images)
    loss = criterion(outputs, labels)
    loss.backward()
    optimizer.step()

    # extra forward without no_grad
    val_out = model(images)
    _val_cache.append(val_out)        # autograd graph stays alive
    _val_cache.append(images.clone()) # extra device copy
    return outputs, loss
An extra forward pass every training batch, running on the same input as the training step. The output is appended to an unbounded list. Critically, the forward pass is not wrapped in torch.no_grad(), so PyTorch builds a full autograd graph and the cached output retains a reference to it.
This pattern appears in practice when someone adds inline validation or logging during training. "I'll just run the model again to check the prediction." Without no_grad(), you keep the entire computation graph in memory for a backward pass that never comes.
The autograd graph retention is the killer. Each cached output isn't just [128, 10] of floats. It's [128, 10] plus pointers back through every intermediate activation in the model, plus those intermediates themselves, plus the graph structure tying them together. The actual memory cost per batch is dozens of megabytes, not the kilobytes you'd estimate from the output tensor alone.
| Backend | Leaky result | Fixed peak |
|---|---|---|
| MPS | OOM at ~20 GB | 704 MB |
| CUDA | OOM at 22.9 GB | (matched fixed peak baseline) |
Both machines crashed. The 24 GB NVIDIA A30 in under two minutes. The 16 GB Mac mini got further than physical memory thanks to MPS's overcommit (unified memory can swap to SSD), but eventually died around 20 GB.
This is the leak I think about when I deploy training code. The bug is five lines. The fix is two:
with torch.no_grad():
    val_out = model(images)
    val_metric = val_out.mean().item()
torch.no_grad() prevents graph construction. .item() extracts a Python float. The metric you care about ends up on the CPU heap as a scalar, and the model output is freed at the end of the block.
There's no version of this leak where CUDA's caching allocator saves you. The bug retains references the allocator can't free. Five lines of bad code take down a 24 GB GPU.
What CUDA changes that's not a leak
A small detail that surprised me. CUDA baseline validation accuracy on the same model, same data, same hyperparameters: 52.3%. MPS baseline: 46.8%. Same code, six percentage points apart.
This is not a bug, and not really a finding either, but worth mentioning. The accuracy difference comes from numerical precision differences between the backends. Different floating-point accumulation orders, different cuDNN kernels, different intermediate representations of the same arithmetic. Single-precision floating point is not associative, so different evaluation orders give slightly different results, and at training scale those small differences compound.
The implication is just: cross-backend reproducibility of model quality is not guaranteed. If you're getting one number on your laptop and a different number on the cluster, the model isn't broken. The hardware is doing the math in a different order.
For someone trying to debug a quality regression by running on a different backend, this is a real trap.
The other four leaks
For completeness, here are the four I haven't written about in detail.
| Leak | MPS ratio | CUDA ratio | Note |
|---|---|---|---|
| Device Tensor Retention | 2.61x | 1.90x | The running_loss += loss (without .item()) bug, scaled up. Real, common, low drama. |
| Autocast Scope | 11.51x | 2.13x | Narrow autocast scope plus unbounded intermediate capture. The narrow scope is the context. The unbounded list is the mechanism. |
| Optimizer State Duplication | 4.40x | 3.04x | Creating throwaway Adam optimizers without cleanup. Each holds ~88 MB of moment buffers (exp_avg, exp_avg_sq) on the device. |
| Detached Graph Fragments | 2.74x | 1.64x | .detach().requires_grad_(True) creating orphan graphs from cached outputs. .detach() does not free the tensor; it only disconnects from the original graph. |
All four are real bugs you'll see in production code. None of them OOM'd anything. All of them are clearly visible in the timeline PNGs in the repo's artifacts directory.
Five things I'm taking with me
One. The bugs that matter are bugs on every backend. If a leak is severe enough to matter in production, it'll be visible on whatever hardware you profile on. The interesting question is not "will I catch it" but "how badly will I misjudge its severity if I only profile in one place."
Two. CUDA's caching allocator dampens leak signals by a factor of two to six. That's not nothing. A leak that triples your peak memory on a Mac shows up as a 50% bump on the cluster. You'll notice both. You'll prioritize the first one more, and you'd be right to.
Three. Not every plausible bug reproduces at small scale. Five epochs of CIFAR-10 isn't a stress test. Leak 6 is real but invisible in this configuration. Production training runs are 100x to 1000x larger, and what's invisible at 10K samples is a paging crisis at 10M.
Four. torch.no_grad() is not optional. The single most catastrophic pattern in the catalog (Leak 7) is what happens when you forget to use it for an evaluation forward pass. It will OOM any hardware you have.
Five. Cloud GPU experimentation is cheaper than people think. Total cost of validating eight leak patterns across 17 CUDA training runs: $0.20. The setup friction is real (one afternoon of getting jl working), but the marginal cost per experiment after that is rounding error. If you're hesitating because of cost, the bottleneck is somewhere else.
What's next
A few things I want to extend this with:
- Distributed training. Memory leaks in gradient synchronization buffers (DDP, FSDP) are a separate class of bug that doesn't appear in single-GPU training. Stormlog has cross-rank timeline visualization that's designed for exactly this, and I haven't exercised it yet.
- CI regression gating. Stormlog ships a benchmark harness that can fail a PR if a code change introduces memory regression against a baseline. The leaks lab is a natural baseline. If I can get this running in GitHub Actions, every PR to a real model repo could gate on "no new leaks."
- Larger training runs. Run Leak 6 (the silent one) at 50 epochs or 100K samples and see when it stops being invisible. Find the scale threshold.
If you want to reproduce any of this on your own hardware, the repo's README has the full setup. bash run_all.sh reproduces the MPS side. bash run_cuda.sh reproduces the CUDA side. The numbers come back.
A note on tools: this work uses Stormlog, an open-source GPU memory profiler for PyTorch and TensorFlow. I'm one of its three maintainers, alongside Silas Asamoah and Derrick Dwamena. Building this lab was partly a stress test of our own profiler against a more diverse set of leak patterns than our existing tutorial covered. We found some edge cases in our own validation logic while doing it (MPS overcommit triggers a check that rejects device_used_bytes > device_total_bytes, which is actually legal on Apple's unified memory). The lab is now also a test suite for Stormlog itself.
A note on transparency: every number in this essay is regenerated by running the scripts in the repo. The CUDA artifacts live in artifacts/cuda/. The MPS artifacts live in artifacts/. The cross-platform report is at reports/cross_platform_comparison.md. If anything doesn't reproduce on your machine, file an issue and I'll dig in.